A 3D portfolio Google can read and a phone can run
A site with a black hole ray-traced in real time is usually invisible to search engines and heavy on a phone. The rules, effect levels and measurements that keep this one from being either.

Jonás Javier Encarnación10 min read
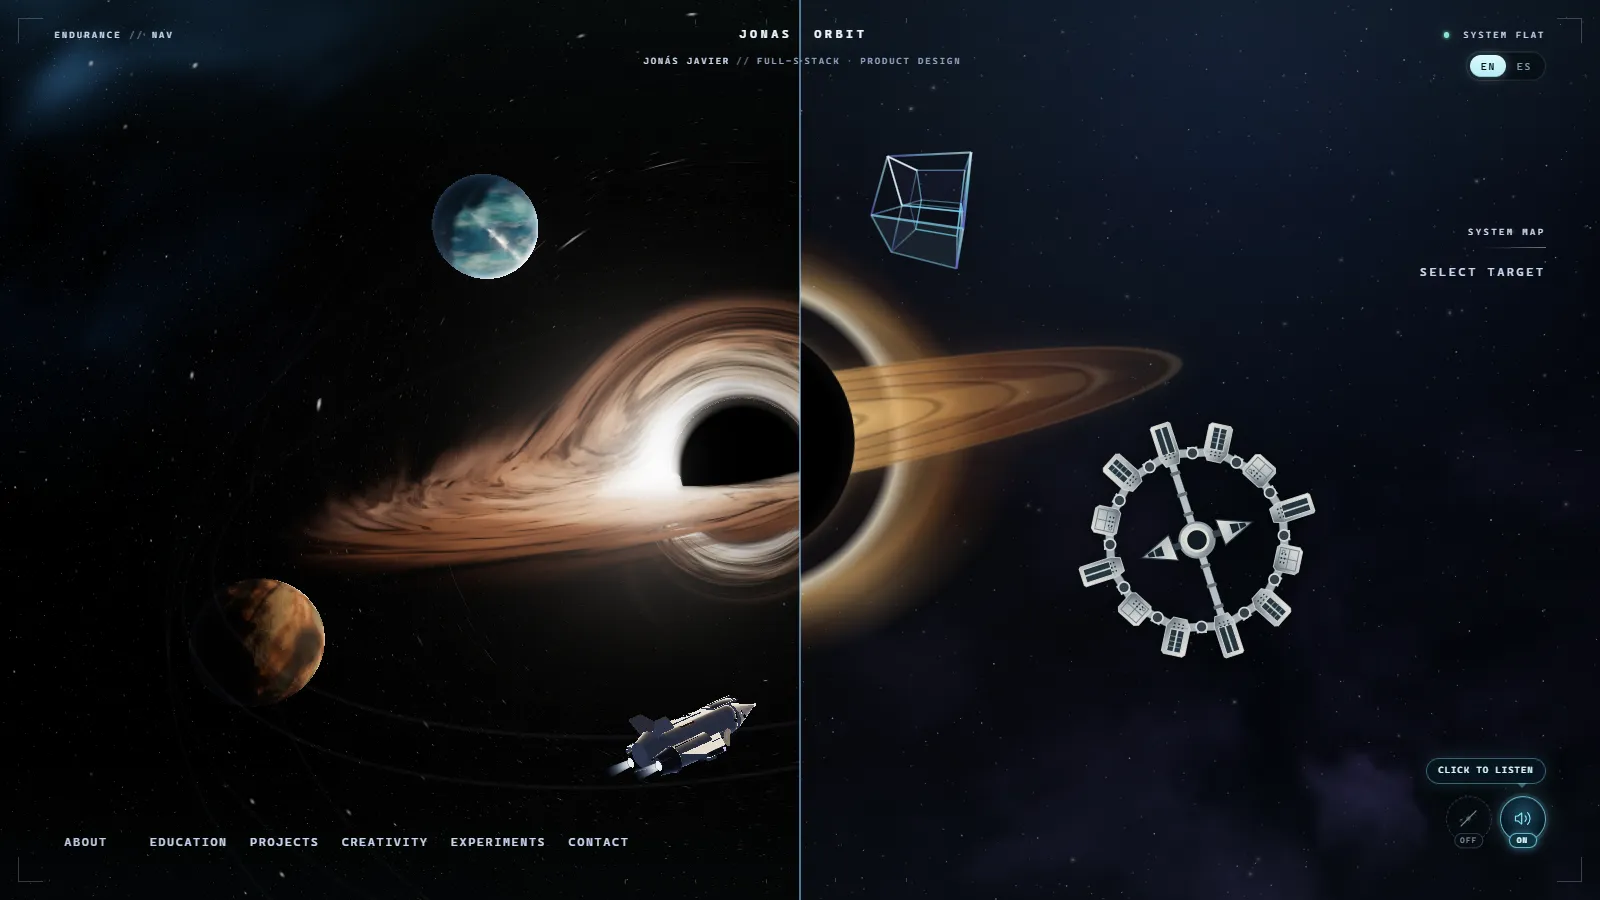
3D portfolios have a bad reputation for two reasons, and both are fair. To a
search engine they're usually an empty <canvas>: all the text lives inside the
scene and there's nothing to index. And on a phone they're usually a black
screen that takes a while to start, heats up and drains the battery.
This site has a black hole traced pixel by pixel in a shader, with six bodies around it. This post covers the rules and pieces that keep it readable for Google and usable on a phone, with the measured numbers — and with what still isn't solved.
The rule: the scene is never the content
Before a single line of Three.js, one non-negotiable rule was written down: every page's served HTML contains the real text, without JavaScript. The scene sits behind, decorates and orients, but it's not where the meaning lives.
In practice that comes down to four things:
- The
<canvas>isaria-hidden, fixed behind the page (position: fixed; z-index: -1; pointer-events: none) and contains not one word. - On the home page, the name and role are in a real
<h1>, and the six destinations are six real<a href>links with a minimum 44 px touch target. The clickable "bodies" over the scene are copies hidden from screen readers (aria-hidden, out of the tab order): the link that counts is the text one. - On the server, the effect level is always flat. Next.js renders the HTML without knowing whether the visitor has a GPU, so that HTML never depends on WebGL.
- The canvas must not be the largest contentful paint (LCP): by design, what paints first is light HTML and CSS.
What someone without JavaScript sees
The most direct test is to turn JavaScript off and load the home page. This is what you get:
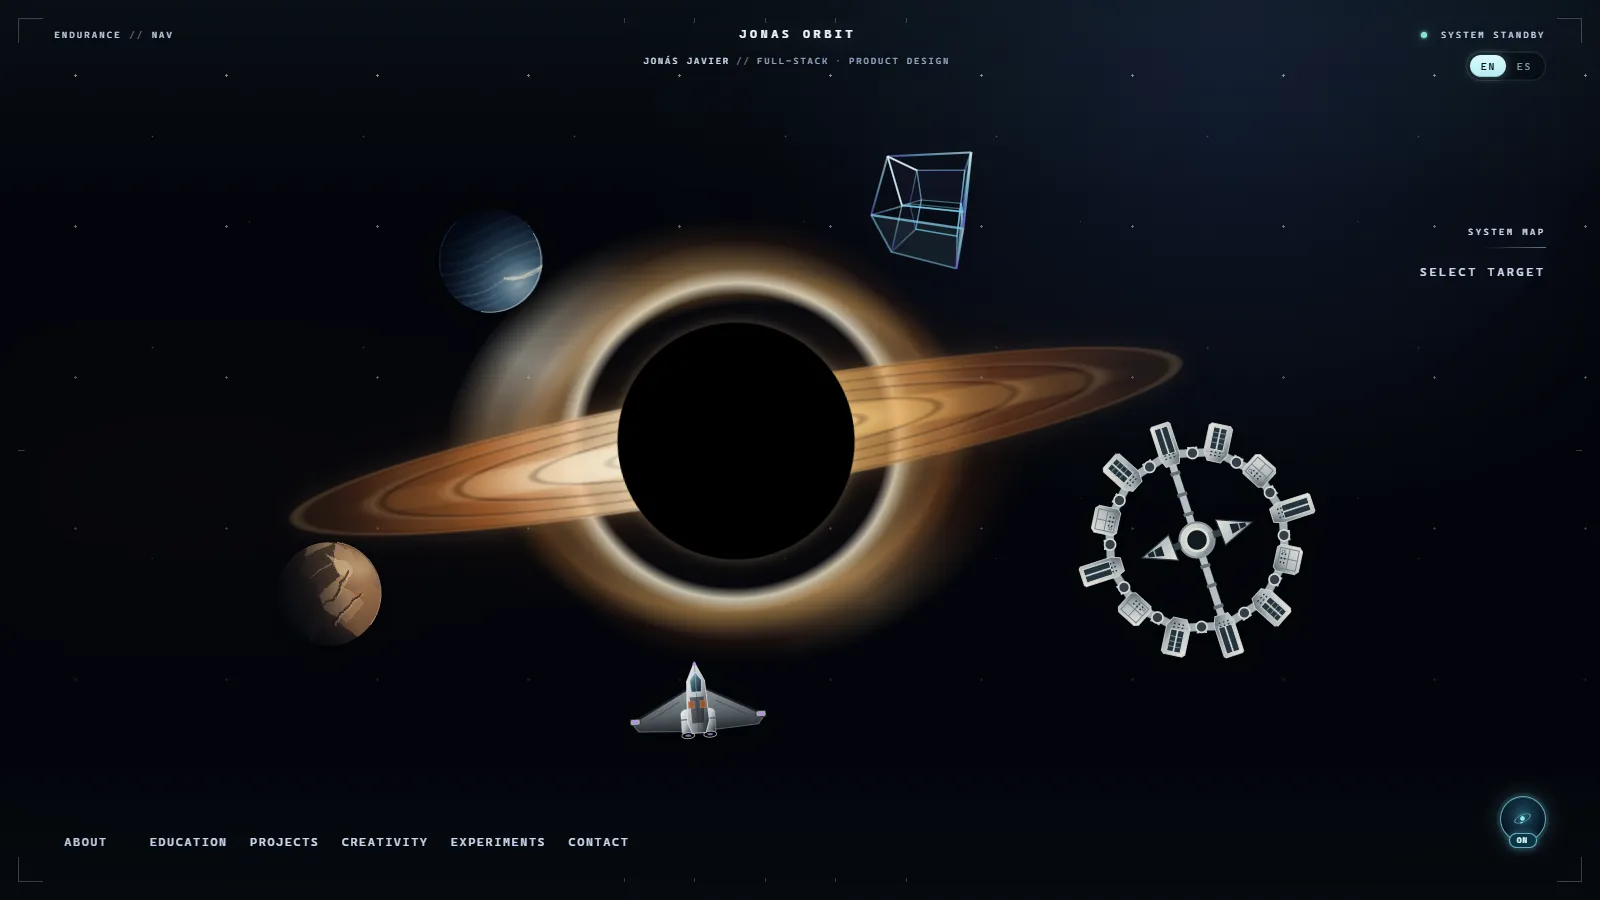
It isn't an "enable JavaScript" screen: it's the site. The links work, the text is there and the composition is the same. It's also, almost pixel for pixel, what a visitor sees without WebGL2 or with effects turned off.
Three levels: flat, orbit and deep
Having WebGL doesn't mean a browser should run the scene. A device with a
software GPU takes seconds to draw a single frame of the raymarch: measured on
SwiftShader, one frame blocks the main thread for about 6 seconds. So the site
chooses between three levels — flat, orbit and deep — with a pure function
that takes signals and returns a verdict:
if (!signals.hasWebGL2) {
  return { level: "flat", reason: "sin-webgl2", canOverride: false };
}
// …
function weakDevice(signals: CapabilitySignals): CapabilityVerdict | null {
  if (isSoftwareRenderer(signals.renderer)) {
    return { level: "flat", reason: "gpu-por-software", canOverride: true };
  }
  if (signals.effectiveType === "slow-2g" || signals.effectiveType === "2g") {
    return { level: "flat", reason: "red-lenta", canOverride: true };
  }
  if (signals.deviceMemory !== undefined && signals.deviceMemory <= 2) {
    return { level: "flat", reason: "memoria-corta", canOverride: true };
  }
  return null;
}
A few details that matter:
- A software GPU is detected, not guessed. A throwaway canvas reads the
renderer name through
WEBGL_debug_renderer_infoand checks it againstswiftshader,llvmpipe,softpipeand so on. It then releases that context withWEBGL_lose_contextand caches the answer for the session. - A missing signal doesn't count against you. Safari exposes neither
deviceMemorynor the connection type; treating that absence as "weak device" would leave every iPhone without the scene. - The visitor decides. The motion button, bottom right, turns everything
off; and whoever turns it on deliberately gets the scene even if the device
looks weak. The code reserves the top level,
deep(more steps per pixel in the black hole), for desktops with green signals: a screen at least 1100 px wide, a fine pointer and eight cores or eight gigabytes, or no data.
The flat level isn't a punishment
The flat level isn't an apologetic error page. It's an atlas drawn with SVG and CSS with the same composition as the scene: Gargantua with its disk, the planets, the ships and the tesseract — the last one computed with the same function as the 3D version. Each body's coordinates are hand-directed for three screen formats (wide, portrait and short).
And it downloads zero bytes of 3D: three.js and the scene are only
requested at orbit or deep. If the browser loses the WebGL context mid-visit
or the load fails, the scene drops to flat and doesn't try again during that
visit: a flat site beats one that flickers.
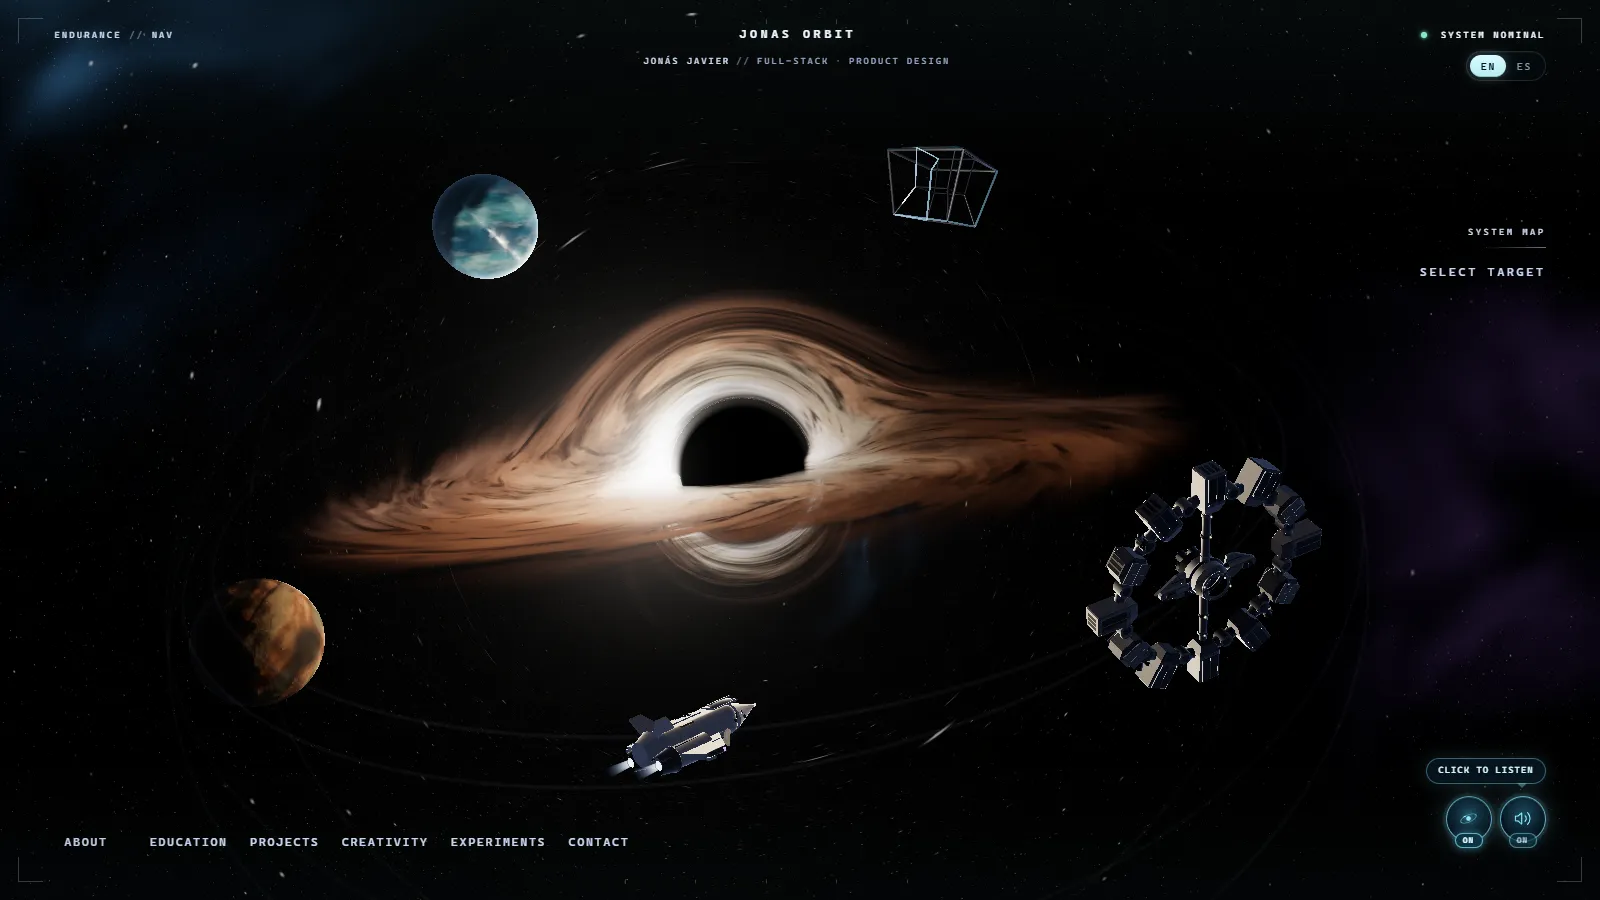
Load the 3D once it's out of the way
On the home page the scene is the star and loads as soon as the page is ready. On every other page — where the content covers the scene — there's no point in it competing with the main image and with hydration. There it waits until the page has loaded and the browser is idle:
function whenIdle() {
  if (typeof window.requestIdleCallback === "function") {
    window.requestIdleCallback(settle, { timeout: 2000 });
  } else {
    window.setTimeout(settle, 0);
  }
}
// …
if (document.readyState === "complete") whenIdle();
else window.addEventListener("load", whenIdle, { once: true });
Safari has no requestIdleCallback; there it fires right after load. A fixed
delay instead used to collide with the user's first interaction. Once reached,
the state holds for the whole visit: navigating doesn't wait again.
Even the level decision waits. That WebGL probe costs about 250 ms on a Chrome
without a GPU — the one PageSpeed uses — and Lighthouse multiplies CPU by four,
so it was a task of nearly a second on every page. three.js comes in through a
dynamic import() and never in the initial load.
Compile shaders without freezing the page
The black hole shader is about 140 KB of GLSL. Compiling it all at once
blocked the page for 2.4 to 2.7 seconds when arriving on the home page. The fix
was compileAsync, which uses the KHR_parallel_shader_compile extension to
compile in parallel before the first frame:
if (renderer.extensions.has("KHR_parallel_shader_compile")) {
  const compiled = Promise.all([
    renderer.compileAsync(marchScene, quadCamera),
    renderer.compileAsync(bodyScene, bodyCamera),
    canAccumulate ? renderer.compileAsync(displayScene, quadCamera) : null,
  ]);
  void compiled.catch(() => undefined).then(startLoop);
} else {
  startLoop();
}
Measured with mobile Lighthouse on a machine with a real integrated GPU: Total Blocking Time went from 7.95 s to about 2.0 s, Time to Interactive from 12.0 to 7.5 s and Speed Index from 7.1 to 4.1 s. Firefox lacks the extension and keeps the old path.
Images: what gets painted, not what fits
Half of the site's performance gains had nothing to do with 3D. A page-by-page Lighthouse review found three classic problems:
- A lying
sizes. The photos in the About constellation, painted at about 114 px on a phone (the portrait at 174), declared a much larger size, and the phone downloaded the 640 and 960 px versions: about 700 KB for a handful of thumbnails. Withsizesset to what's actually painted (120 and 180 px), that stopped. - Phone crops. Header images have their own portrait crop: 92 KB instead of
214 KB, and 53 KB instead of 195 KB. Each one is preloaded with
fetchPriority: "high"and its ownmedia, so the phone doesn't download the desktop version. - Steps and quality. An 800 px step and WebP quality 80 nearly halved the image weight of four pages: from 1313 to 725 KB, 1030 to 549, 756 to 407 and 601 to 327.
A phone isn't a small desktop
On a phone the scene starts at one render pixel per screen point. From there, a small governor measures the real frame pace and raises resolution to 1.25 and 1.5 only if the device can sustain it:
| Constant | Value | Purpose |
|---|---|---|
| Steps | 1 → 1.25 → 1.5 px per point | Never above devicePixelRatio |
| Window | 45 frames | ~0.75 s at 60 Hz |
| Settling | 30 frames | Discarded after each change |
| Fast | p75 ≤ 18.5 ms | Step up |
| Slow | p75 ≥ 26 ms | Step down and close the ceiling |
| Tolerance | ×1.15 over its best pace | 90 and 120 Hz screens |
const p75 = sorted[Math.floor(sorted.length * 0.75)];
pace = Math.min(pace, p75);
const held = p75 <= pace * PACE_TOLERANCE;
if (index > 0 && (p75 >= SLOW_MS || !held)) {
  index -= 1; ceiling = index; restart(); return true; // undo and close the ceiling
}
if (held && p75 <= FAST_MS && index < ceiling) {
  index += 1; restart(); return true;
}
The first version compared against a fixed 60 fps and got 90 and 120 Hz screens wrong: 60 fps counted as "headroom" while the phone was dropping frames. Now each device is compared with its own best pace. And a step that can't be sustained isn't tried again: the phone doesn't flip between two resolutions. The governor pauses during transitions, with the tab hidden and while the scene is covered, so it never measures the wrong thing.
Never two contexts drawing
Several pages have their own WebGL: Miller's ocean, the wormhole on Contact, the Observatory. If the background scene kept drawing behind them, the phone would render two scenes at once and only show one.
On pages that cover it, the scene stops requesting frames. The Observatory goes further: its canvas fills the screen for the whole visit, so there the persistent scene releases its WebGL context and video memory, and recreates it on the way out. Pausing the loop wasn't enough: the context stayed alive.
Measure without cheating
One more project rule: code whose only purpose is to change an audit result is forbidden. No sniffing Lighthouse's user agent to serve it a lighter page.
Lighthouse is audited with ?no3d=1, which is exactly the same as pressing the
motion button: any visitor can type it. Continuous integration runs Lighthouse
three times on the home page in each language and takes the median, with
thresholds that fail the build:
- every category ≥ 0.9;
- CLS ≤ 0.1;
- Total Blocking Time ≤ 300 ms.
The improvements were measured with local Lighthouse against next start,
three runs, median, always A/B against the previous version. A local machine's
absolute numbers aren't PageSpeed's, but the difference between A and B is
reliable. Some results from that work:
| Page | Before | After |
|---|---|---|
| Projects | 66 | 79–82 (TBT 762 → ~250 ms) |
| Creativity | 72 | 84 |
| Experiments | 74 | 81–92 |
| Education | 68 | 81 |
The last full measurement of the home page without the scene (?no3d=1,
locally, three runs) scored 98 for performance and 100 for accessibility, best
practices and SEO, with a median LCP of 2.32 s and a TBT of 66.5 ms.
What isn't solved yet
It would be dishonest to stop here. Two things still weigh:
- The framework's JavaScript. The Next.js 16 plus React 19 baseline is already around 146 KB compressed before writing a line, and on a simulated phone that code takes nearly two seconds of CPU. LCP is tied to it.
- The server. With no CDN in front, time to first byte is between 300 and 600 ms.
Neither is fixed with more tricks in the scene.
The rest of SEO, briefly
Everything above is what makes the page readable. What helps it be
understood is the usual, done properly: structured data for the person, the site
and each piece of work; a sitemap with images and the relationship between
languages; and a canonical and hreflang on every page. The languages part has
its own post.
Try it
Open the home page and press the motion button, bottom right: the scene switches off and the flat atlas remains, with the same content. If you want to see the black hole up close, it's in the Observatory, and here's how it's built.
If you have a product that needs to look good and load fast at the same time, here's how I work.